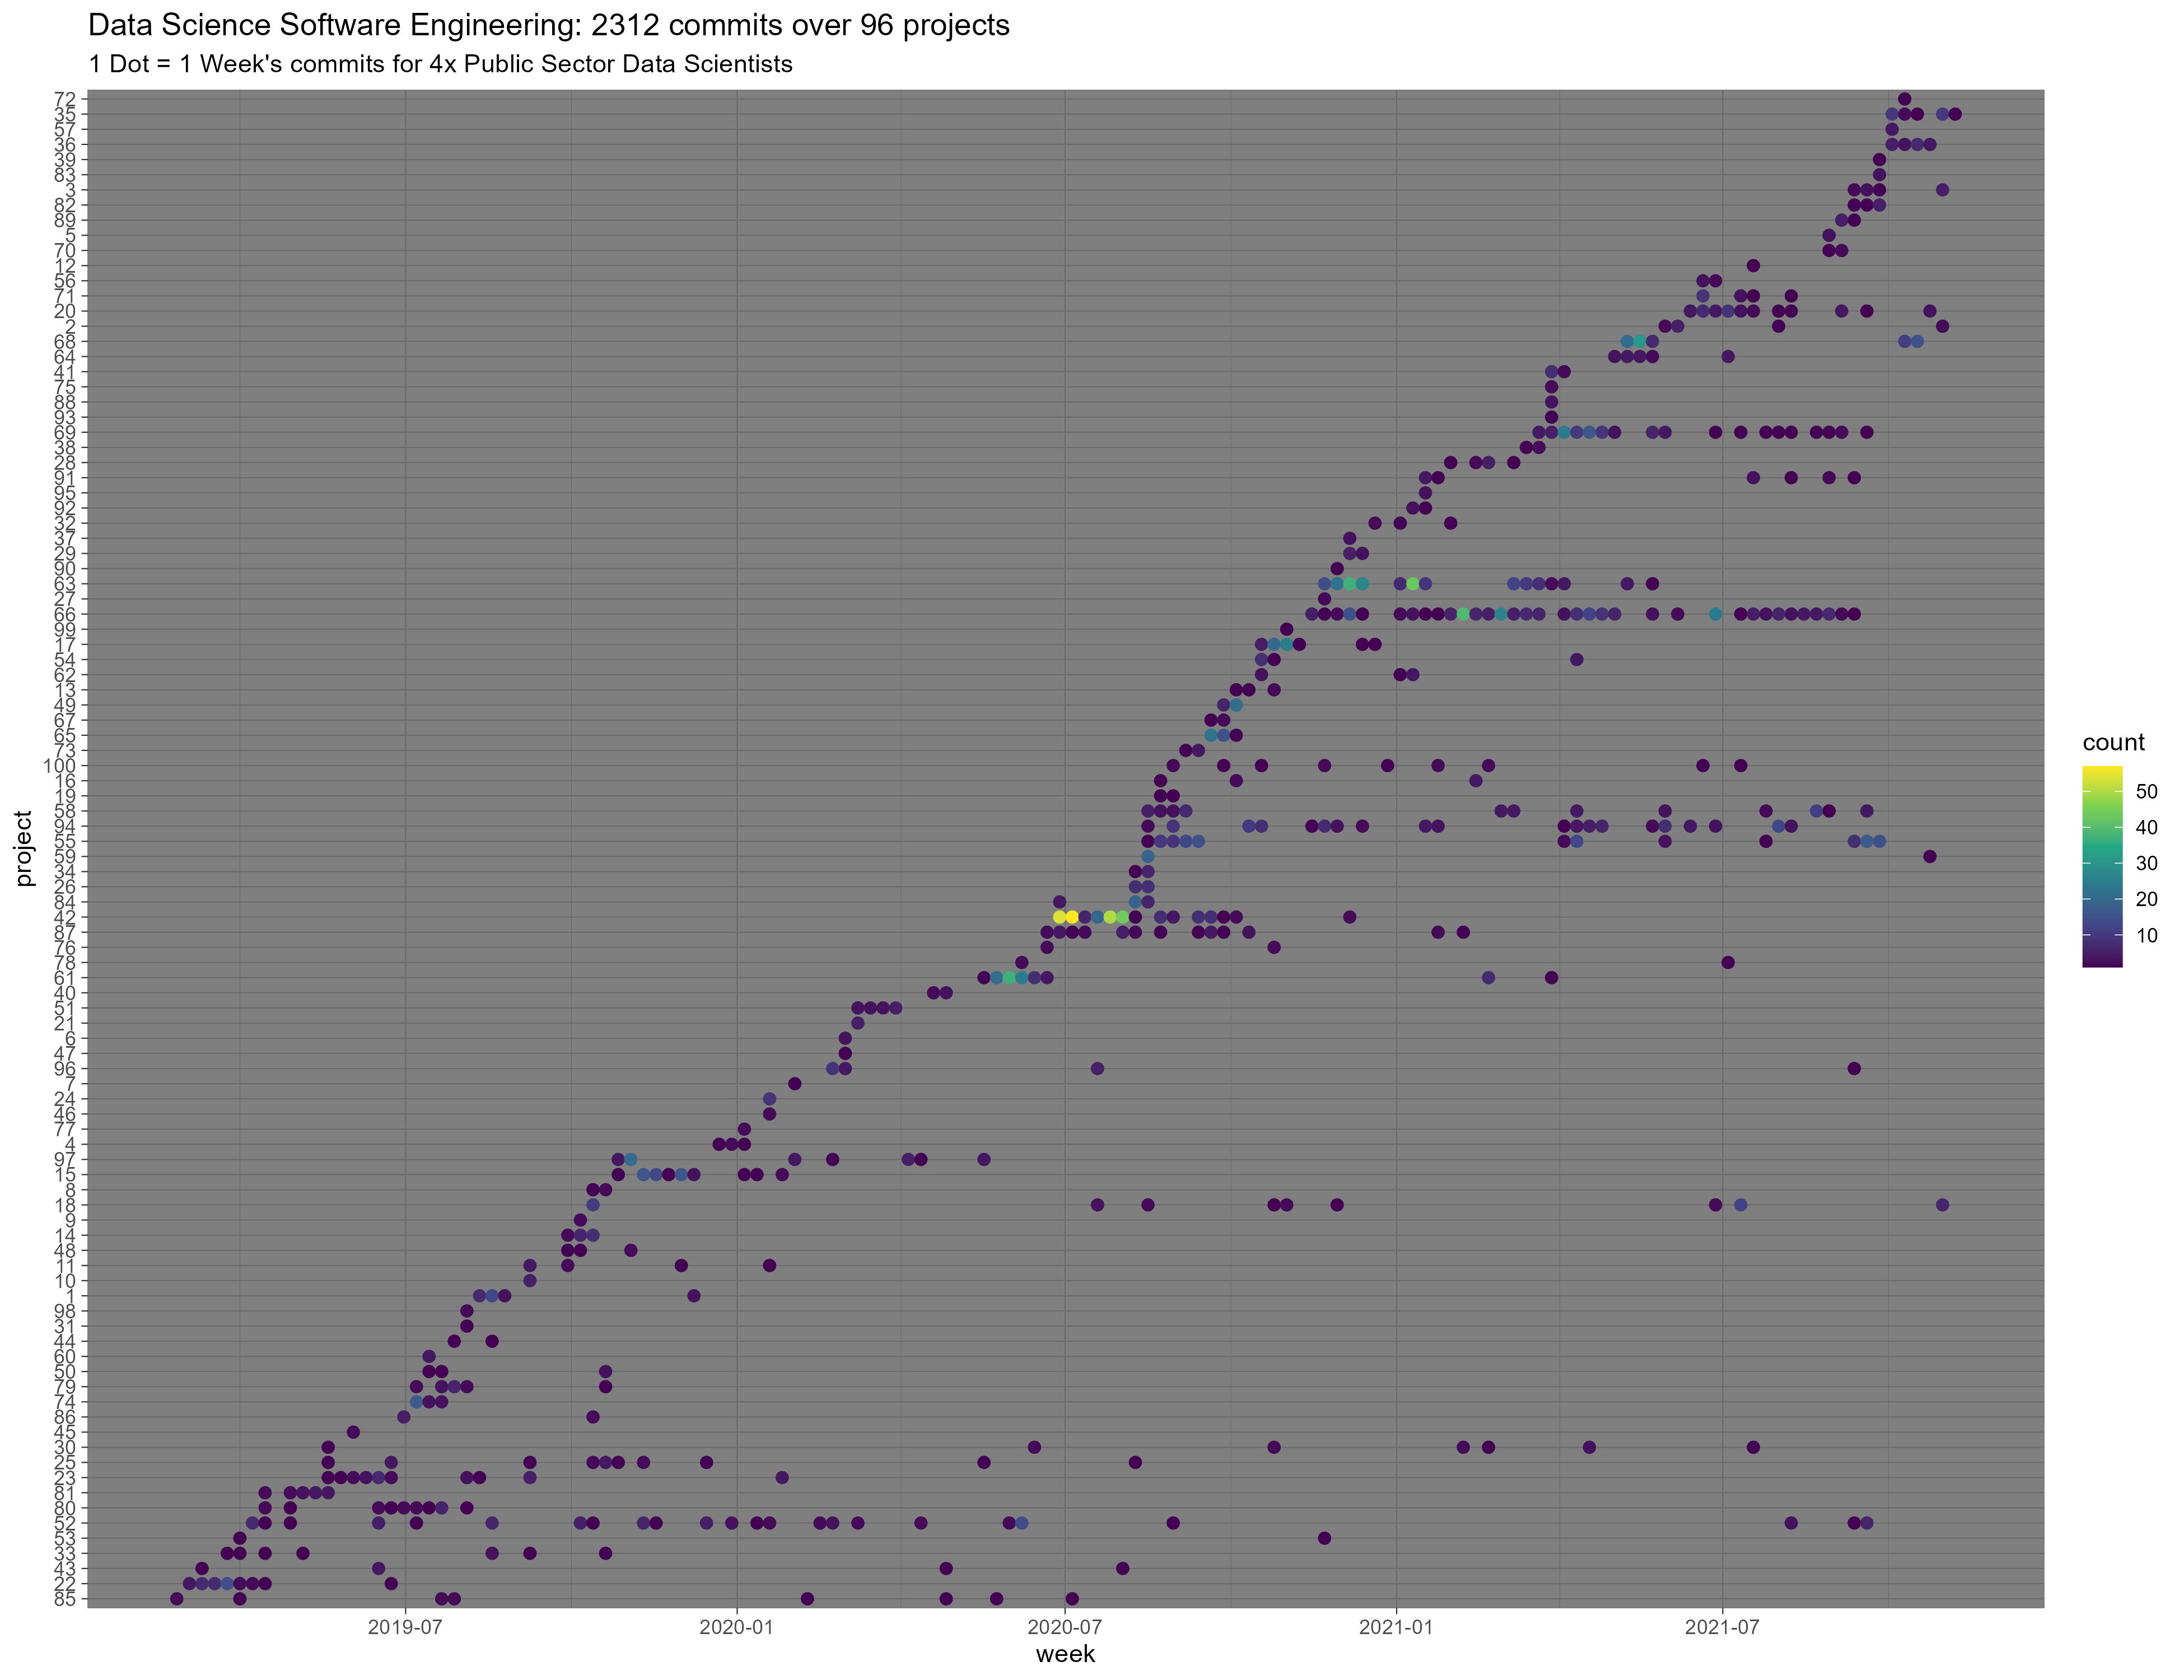
Having a second stab at a plot of my team’s commits since it has come to light that an unnamed someone was using a gmail for user.email on most of their work commits:
https://cdn.uploads.micro.blog/27894/2021/2c62b05d4a.png
I also binned the dots, instead of using alpha, and of course, that works a lot better.
Regarding software engineering for data science, I think this highlights some important issues I am going to expand on in an upcoming long-form piece. As a teaser: In a world with so many projects, and code constantly flowing between those projects, are “project-oriented workflows” that end their opinions at the project folder underfitting the needs of Data Science teams?
Make your own
If you’re feeling brave I would love to compare patterns with other teams!
It’s hardly any code (if you have a flat repository structure like mine) thanks to the {gert} package:
library(gert)
library(withr)
library(tidyverse)
library(lubridate)

scan_dir <- "c:/repos"
repos <- list.dirs(scan_dir, recursive = FALSE)

all_commits <- map_dfr(repos, function(repo) {
  with_dir(repo, {
    branches <- git_branch_list() |> pluck("name")
    repo_commits <- map_dfr(branches, function(branch) {
      commits <- git_log(ref = branch)
      commits$branch <- branch
      commits
    })
    repo_commits$repo <- repo
    repo_commits
  })
})


qfes_commits <-
  all_commits |>
  filter(grepl("@qfes|North", author))


duplicates <- duplicated(qfes_commits$commit)

p <-
  qfes_commits |>
  filter(!duplicates) |>
  group_by(repo) |>
  mutate(first_commit = min(time)) |>
  mutate(repo_num = cur_group_id()) |>
  ungroup() |>
  group_by(repo_num, first_commit, week = floor_date(time, "week")) |>
  summarise(
    count = n(),
    .groups = "drop"
  ) |>
  ggplot(aes(
    x = week,
    y = fct_reorder(as.character(repo_num), first_commit),
    colour = count
  )) +
  geom_point(size = 2) +
  labs(
    title = "Data Science Software Engineering: 2312 commits over 96 projects",
    subtitle = "1 Dot = 1 Week's commits for 4x Public Sector Data Scientists",
    y = "project"
  ) +
  scale_colour_viridis_c() +
  theme_dark()

ggsave(
  "commits.png",
  p,
  device = ragg::agg_png,
  height = 10,
  width = 13
)